检验医学 ›› 2026, Vol. 41 ›› Issue (6): 603-608.DOI: 10.3969/j.issn.1673-8640.2026.06.013

• 论著 • 上一篇    下一篇

2型糖尿病继发糖尿病肾病列线图模型的构建

黄正举, 陈雅斌(), 王婉妮, 陈金图   

  1. 福建医科大学附属泉州第一医院检验科福建 泉州 362000
  • 收稿日期:2025-04-10 修回日期:2025-10-29 出版日期:2026-06-30 发布日期:2026-07-01
  • 通讯作者: 陈雅斌,E-mail:352374975@qq.com
  • 作者简介:黄正举,男,1995年生,学士,技师,主要从事临床基础检验工作。

Construction of a nomogram prediction model for secondary diabetic kidney disease in patients with type 2 diabetes mellitus

HUANG Zhengju, CHEN Yabin(), WANG Wanni, CHEN Jintu   

  1. Department of Clinical LaboratoryQuanzhou First Hospital,Fujian Medical UniversityQuanzhou 362000,Fujian, China
  • Received:2025-04-10 Revised:2025-10-29 Online:2026-06-30 Published:2026-07-01

摘要:

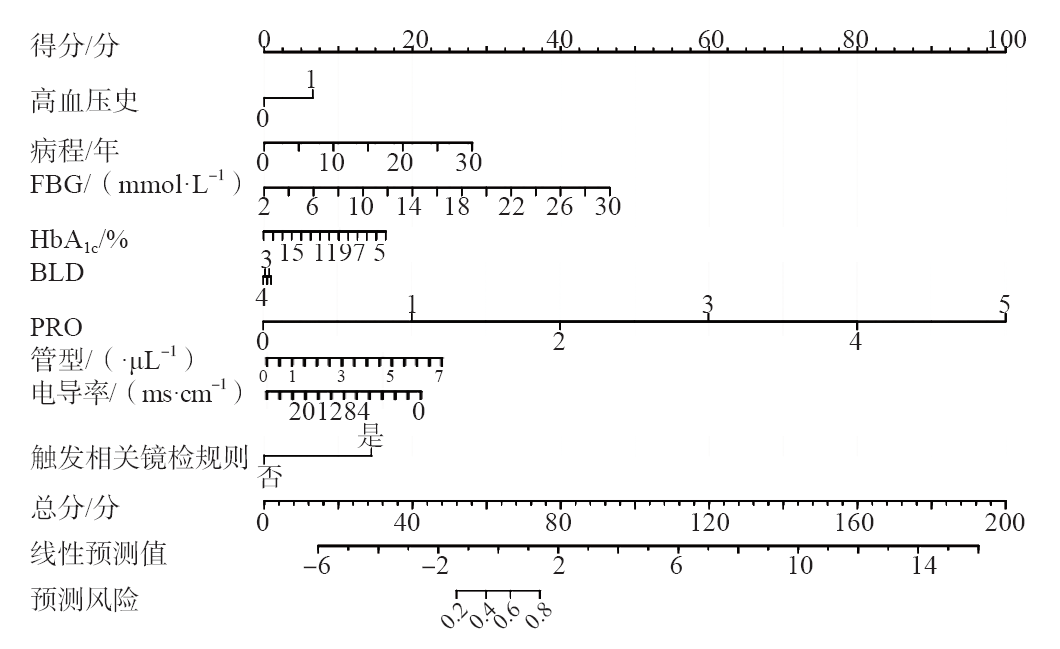
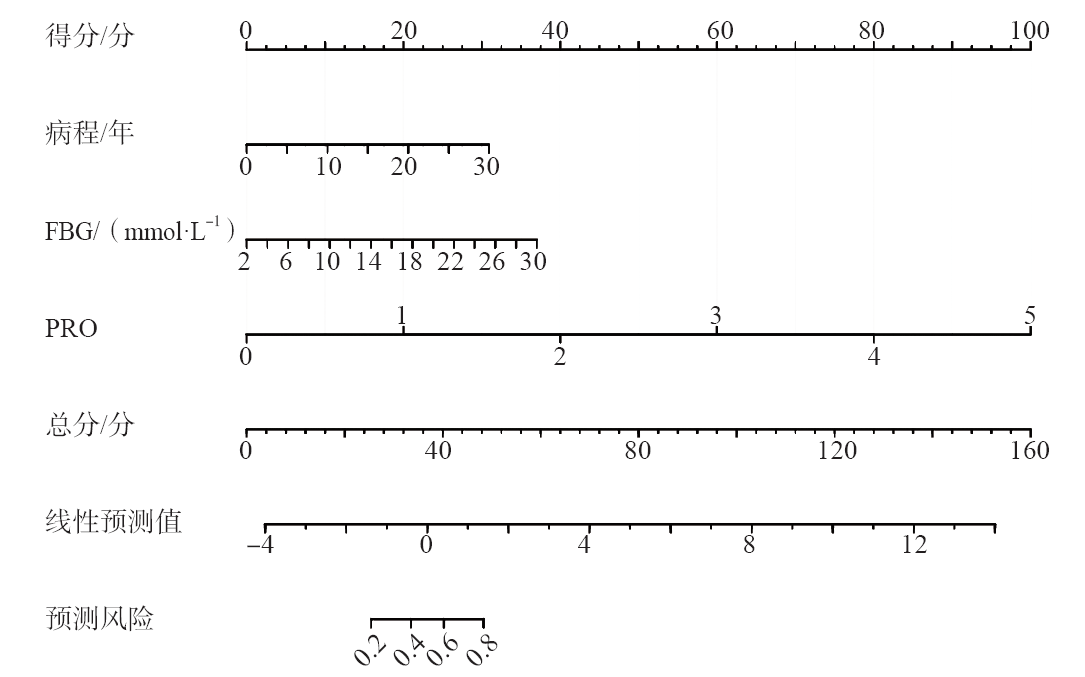
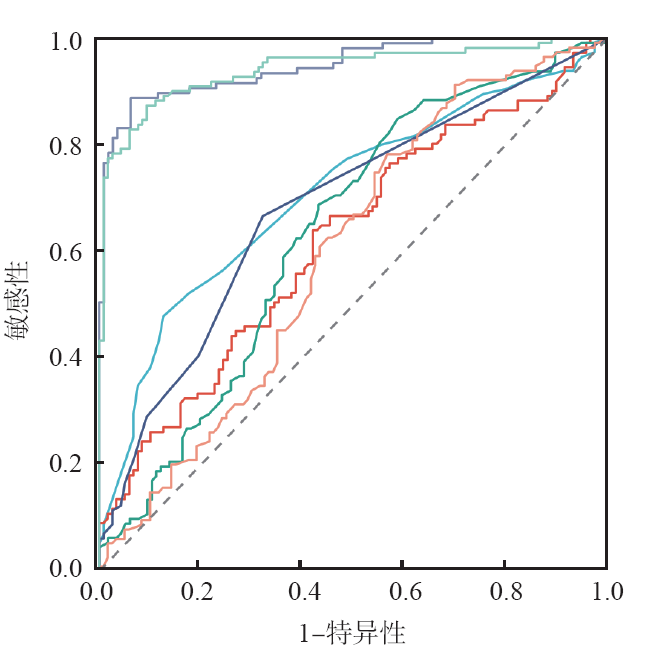
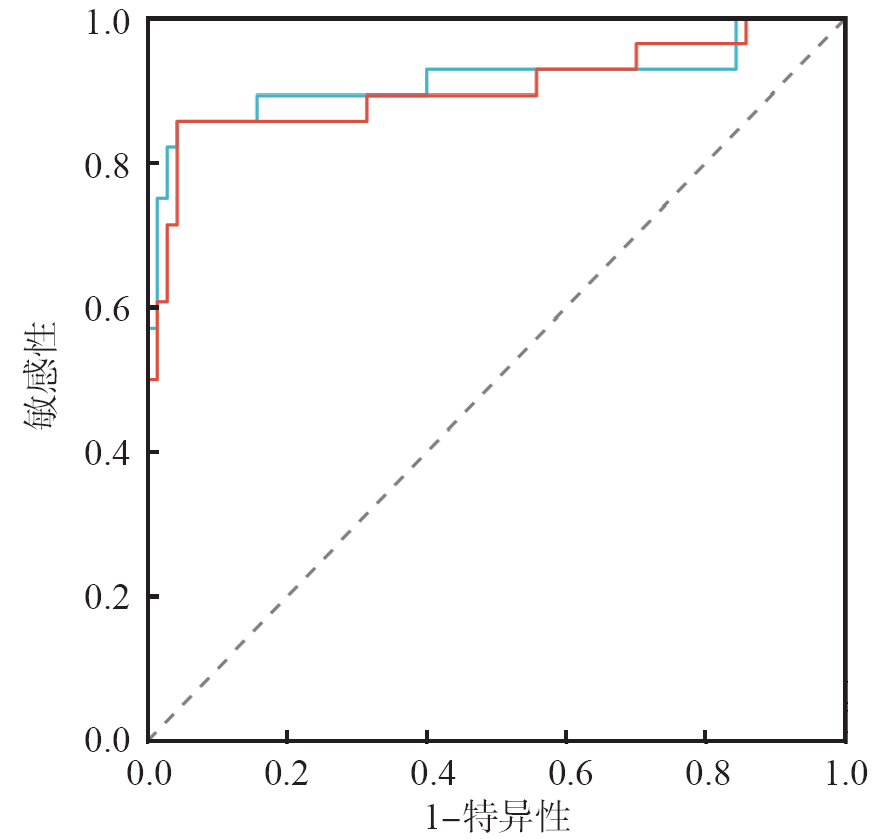
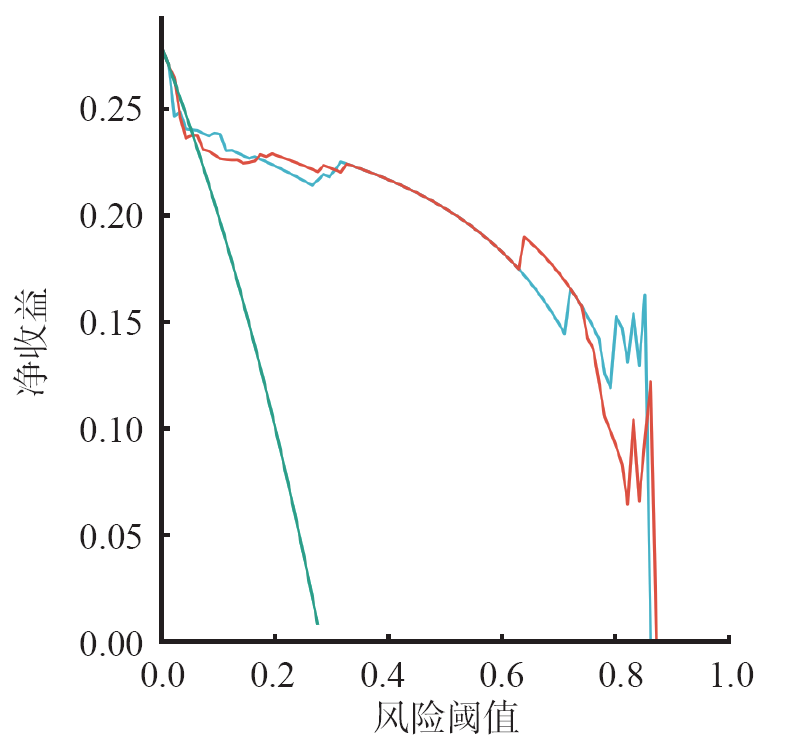
目的 构建用于预测2型糖尿病(T2DM)患者继发糖尿病慢性肾病(DKD)的列线图模型,并评价其有效性。方法 选取2024年1月—2025年6月福建医科大学附属泉州第一医院T2DM继发DKD患者143例(DKD组)和单纯T2DM患者190例(T2DM组)。收集所有研究对象的临床资料和实验室检测结果。将2024年的235例患者数据纳入训练集,将2025年的98例患者数据纳入测试集。比较训练集内继发DKD和单纯T2DM患者相关临床资料、空腹血糖(FBG)、糖化血红蛋白(HbA1c)、尿微量白蛋白/肌酐比值(UACR)、尿干化学和尿有形成分检测结果的差异。采用Logistic回归分析评估训练集DKD发生的危险因素,并建立列线图模型;采用受试者工作特征(ROC)曲线评估列线图模型及其单项计量指标诊断DKD的效能。基于测试集数据,采用ROC曲线和决策曲线评估列线图模型的效能。结果 训练集内,DKD组和T2DM组高血压史、病程、FBG、HbA1c、尿干化学和尿有形成分差异均有统计学意义(P<0.05)。病程延长、FBG水平升高、尿蛋白(PRO)阳性是DKD发生的独立危险因素。各危险因素和基于单危险因素(列线图1)、独立危险因素(列线图2)构建的2个列线图模型均可有效筛查DKD,曲线下面积(AUC)为0.598~0.949。2个列线图模型诊断DKD的AUC均高于各单一指标。2个列线图模型筛查测试集内DKD的AUC均>0.900。10%风险阈值时,列线图1和列线图2临床净收益分别为0.231和0.221。结论 构建的列线图模型可为临床快速、直观评估T2DM患者继发DKD提供参考。

关键词: 糖尿病慢性肾病, 2型糖尿病, 危险因素, 列线图模型

Abstract:

Objective To construct a nomogram model for predicting secondary diabetic kidney disease(DKD) in patients with type 2 diabetes mellitus(T2DM),and to evaluate its effectiveness. Methods A total of 143 patients with T2DM secondary to DKD(DKD group) and 190 patients with single T2DM(T2DM group) were enrolled from Quanzhou First Hospital of Fujian Medical University from January 2024 to June 2025. The clinical data and determination results were collected. The data of 235 patients in 2024 were included in the training set,and the data of 98 patients in 2025 were included in the test set. The differences in clinical data,fasting blood glucose(FBG),glycated hemoglobin A1c(HbA1c),urinary microalbumin-to-creatinine ratio(UACR),urinary chemical tests and formed element tests between patients with secondary DKD and patients with single T2DM in the training set were compared. Logistic regression analysis was used to evaluate the risk factors for DKD occurrence in the training set and to construct a nomogram model. Receiver operating characteristic(ROC) curve was used to evaluate the efficacy of the nomogram model and its single measurement indicators in diagnosing DKD. Based on the test set data,the ROC curve and decision curve were used to validate the nomogram model. Results In the training set,there was statistical significance in hypertension history,disease duration,FBG,HbA1c,urinary chemical tests and urinary formed element tests between DKD and T2DM groups(P<0.05). The prolongation of disease duration,elevated FBG level,positive urinary protein(PRO) were independent risk factors for DKD occurrence. Each risk factor and the 2 constructed nomogram models based on risk factors(nomogram 1)and independent risk factors(nomogram 2)could effectively screen for DKD. The areas under curves(AUC) were 0.598-0.949. The AUC of the 2 nomogram models for diagnosing DKD was higher than each single indicator. The AUC for screening DKD in the test set by the 2 nomogram models was >0.900. when the risk threshold was 10%,the clinical net benefits of nomogram 1 and nomogram 2 were 0.231 and 0.221,respectively. Conclusions The constructed nomogram model can provide a reference for clinicians to quickly and intuitively assess whether T2DM patients have secondary DKD.

Key words: Diabetic kidney disease, Type 2 diabetes mellitus, Risk factor, Nomogram model

中图分类号: