检验医学 ›› 2026, Vol. 41 ›› Issue (6): 530-537.DOI: 10.3969/j.issn.1673-8640.2026.06.003

• 临床血脂检测规范化专题 • 上一篇    下一篇

健康成人餐后sd-LDL、sd-LDL%和常规血脂项目参考区间上限分析

胡豪1, 徐晓萍1(), 虞文婷1, 王海军1, 陈盛娇1, 刘伟群2   

  1. 1 上海市虹口区江湾医院检验科上海 200434
    2 上海市虹口区江湾医院体检中心上海 200434
  • 收稿日期:2024-10-11 修回日期:2025-12-12 出版日期:2026-06-30 发布日期:2026-07-01
  • 通讯作者: 徐晓萍,E-mail:xping_xu@qq.com
  • 作者简介:胡 豪,男,1980年生,学士,主管技师,主要从事临床生化和免疫学检验工作。

Analysis of postprandial sd-LDL,sd-LDL% and conventional blood lipid parameter reference cut-off values in healthy adults

HU Hao1, XU Xiaoping1(), YU Wenting1, WANG Haijun1, CHEN Shengjiao1, LIU Weiqun2   

  1. 1 Department of Clinical LaboratoryJiangwan HospitalShanghai 200434, China
    2 Center for Health Check-upJiangwan HospitalShanghai 200434, China
  • Received:2024-10-11 Revised:2025-12-12 Online:2026-06-30 Published:2026-07-01

摘要:

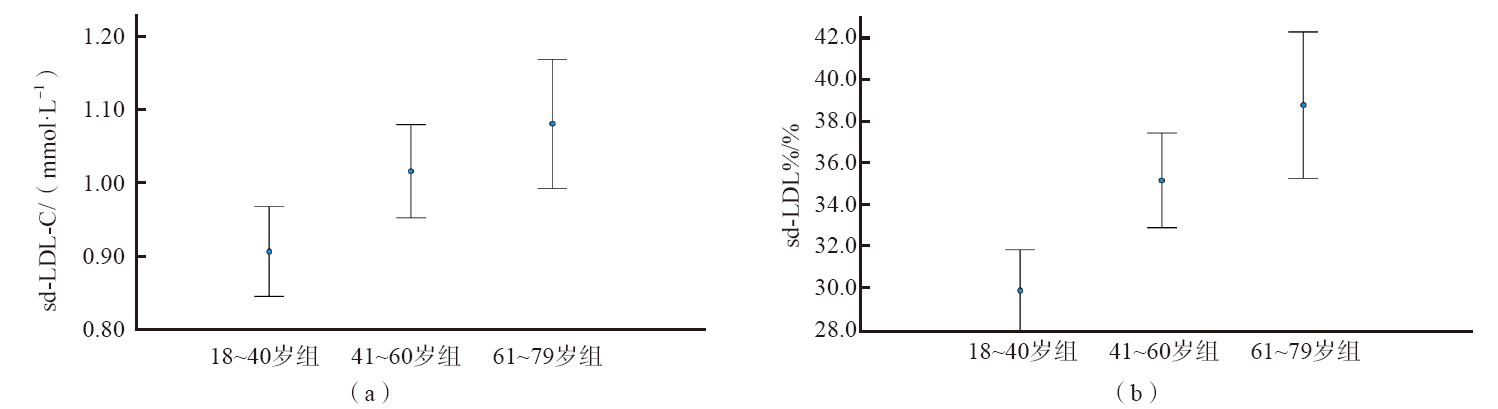
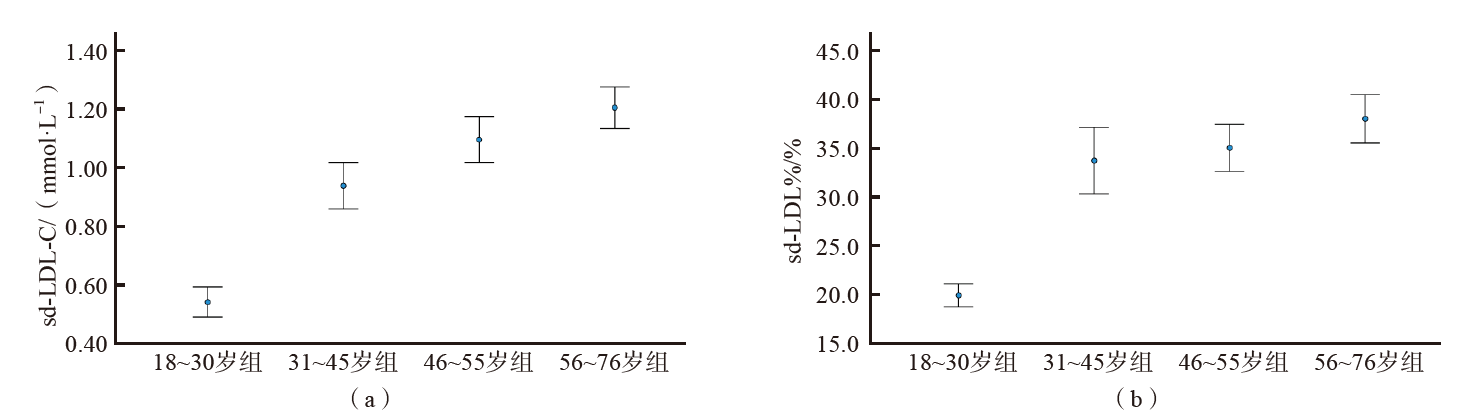
目的 探讨健康成人在平常饮食状态下餐后血脂项目[总胆固醇(TC)、三酰甘油(TG)、高密度脂蛋白胆固醇(HDL-C)、低密度脂蛋白胆固醇(LDL-C)、小而密低密度脂蛋白胆固醇(sd-LDL-C)、非高密度脂蛋白胆固醇(non-HDL-C)、残粒脂蛋白胆固醇(RLP-C)、小而密低密度脂蛋白百分比(sd-LDL%)、TG/HDL-C比值]的变化,并建立各项指标的参考区间上限。方法 选取2024年6月—2025年4月上海市虹口区江湾医院健康体检者1 417名,分别按性别和年龄进行分组,其中男性分为18~40岁组、41~60岁组、>60岁组,女性分为18~30岁组、31~45岁组、46~55岁组、≥56岁组。采集所有研究对象午餐后2~4 h静脉血样本,检测TC、TG、HDL-C、LDL-C、sd-LDL-C,计算non-HDL-C、RLP-C、sd-LDL%和TG/HDL-C比值。统计各项目第90百分位数(P90),并依此建立参考区间上限。结果 男性、女性餐后TC、TG、HDL-C、non-HDL-C、sd-LDL%、TG/HDL-C比值差异均有统计学意义(P<0.05),餐后LDL-C、sd-LDL-C、RLP-C差异均无统计学意义(P>0.05)。男性餐后sd-LDL-C和sd-LDL%均随年龄增长而升高(P<0.05)。女性餐后TC、TG、LDL-C、non-HDL-C、sd-LDL-C水平和sd-LDL%、TG/HDL-C比值均随年龄的增长而升高(P<0.001)。餐后sd-LDL-C与TG、TG/HDL比值、non-HDL-C均呈正相关(r值分别为0.512、0.505、0.421,P<0.01),与HDL-C呈负相关(r=-0.276,P<0.01)。在≤45岁的受检者中,男性除HDL-C低于同年龄段女性(P<0.01)外,其他项目均高于女性(P<0.01)。在>55岁的受检者中,女性餐后TC、TG、HDL-C、LDL-C、non-HDL-C、RLP-C、sd-LDL-C和TG/HDL-C比值均高于男性(P<0.05)。剔除TG>5 mmol·L-1的受检者后,≤60岁男性餐后sd-LDL-C、sd-LDL%的90%参考区间上限分别为<1.61 mmo/L、<52.1%,>60岁男性分别为<1.71 mmol/L、<65.7%;≤45岁女性分别为1.39 mmo·L-1、<43.3%,>45岁女性分别为<1.71 mmo·L-1、<52.7%。结论 初步建立不同性别、年龄健康成人日常普通餐食后血脂指标的90%参考区间上限值。在非空腹状态下,sd-LDL-C、sd-LDL%是反映男性增龄性脂质代谢变化的指标;不同年龄段女性血脂代谢存在差异。

关键词: 小而密低密度脂蛋白, 低密度脂蛋白胆固醇, 高密度脂蛋白胆固醇, 三酰甘油, 总胆固醇, 非空腹, 参考区间上限

Abstract:

Objective To investigate the postprandial blood lipid levels [total cholesterol(TC),triglyceride(TG),high-density lipoprotein cholesterol(HDL-C),low-density lipoprotein cholesterol(LDL-C),small and dense low-density lipoprotein cholesterol(sd-LDL-C),non-high-density lipoprotein cholesterol(non-HDL-C),remnant lipoprotein cholesterol(RLP-C),the percentage of small and dense low-density lipoprotein(sd-LDL%)and the ratio of TG/HDL-C] in healthy adults under normal dietary conditions,and to establish the reference cut-off values. Methods A total of 1 417 healthy subjects who underwent routine physical examinations from June 2024 to April 2025 at Jiangwan Hospital in Hongkou District,Shanghai,were enrolled. They were classified by gender and age. For males,the groups were 18-40 years old,41-60 years old and >60 years old. For females,the groups were 18-30 years old,31-45 years old,46-55 years old and ≥56 years old. The samples were collected from all the subjects for 2-4 h after lunch. TC,TG,HDL-C,LDL-C and sd-LDL-C were determined,and non-HDL-C,RLP-C,sd-LDL% and the ratio of TG/HDL-C were calculated. The 90th percentile (P90)of each item was statistically analyzed,and the upper limits of reference intervals were established. Results There was statistical significance in postprandial TC,TG,HDL-C,non-HDL-C,sd-LDL% and the ratio of TG/HDL-C among males and females(P<0.05),while there was no statistical significance in postprandial LDL-C,sd-LDL-C and RLP-C levels(P>0.05). The levels of sd-LDL-C and sd-LDL% were increased with age in both males and females(P<0.05). The levels of TC,TG,LDL-C,non-HDL-C,sd-LDL-C and sd-LDL% and the TG/HDL-C ratio in postprandial blood of females increased with age (P<0.001). The levels of postprandial sd-LDL-C and TG and the ratio of TG/HDL-C,non-HDL-C were positively correlated(r values were 0.512,0.505 and 0.421,respectively,P<0.01),and negatively correlated with HDL-C(r=-0.276,P<0.01). Among healthy subjects≤45 years old,the blood lipid levels of males,except for HDL-C,were lower than those of females in the same age group(P<0.01),and the other blood lipid levels were higher than those of females(P<0.01). Among healthy subjects>55 years old,the TC,TG,HDL-C,LDL-C,non-HDL-C,RLP-C,sd-LDL-C levels and the ratio of TG/HDL-C were higher in females than in males(P<0.05). After excluding the subjects with TG >5 mmol·L-1,the upper limits of the 90% reference interval for postprandial sd-LDL-C and sd-LDL% were as follows:for males ≤60 years old,<1.61 mmol·L-1 and <52.1%;for males >60 years old,<1.71 mmol·L-1 and <65.7%;for females ≤45 years old,<1.39 mmol·L-1 and <43.3%;for females >45 years old,<1.71 mmol·L-1 and <52.7%. Conclusions The 90% reference upper limit values of blood lipid indicators after daily ordinary meals for healthy adults of different genders and ages have initially established. In a non-fasting state,sd-LDL-C and sd-LDL% are indicators reflecting the blood lipid metabolism changes with aging in males. There are differences in blood lipid metabolism among females of different age groups.

Key words: Small and dense low-density lipoprotein, Low-density lipoprotein cholesterol, High-density lipoprotein cholesterol, Triglyceride, Total cholesterol, Non-fasting, Upper limit of reference interval

中图分类号: