
Laboratory Medicine ›› 2024, Vol. 39 ›› Issue (11): 1084-1090.DOI: 10.3969/j.issn.1673-8640.2024.11.010
Previous Articles Next Articles
ZHANG Qin1, YAO Hanxin1, WANG Boyu1, JU Xinwei2, XU Wei1( )
)
Received:2024-03-26
Revised:2024-07-23
Online:2024-11-30
Published:2024-11-29
Contact:
XU Wei
CLC Number:
ZHANG Qin, YAO Hanxin, WANG Boyu, JU Xinwei, XU Wei. Diagnostic efficacy evaluation of t-PSA and its derived indicator PHI and PI-RADS score for prostate cancer[J]. Laboratory Medicine, 2024, 39(11): 1084-1090.
Add to citation manager EndNote|Ris|BibTeX
URL: https://www.shjyyx.com/EN/10.3969/j.issn.1673-8640.2024.11.010
| 组别 | 例数 | t-PSA/(ng·mL-1) | f-PSA/t-PSA%/% | PHI | PI-RADS评分 | ||
|---|---|---|---|---|---|---|---|
| ≤2分/[例(%)] | 3分/[例(%)] | ≥4分/[例(%)] | |||||
| 良性 疾病组 | 143 | 11.59(6.35~22.63) | 16.27(10.56~22.02) | 34.16(25.28~50.13) | 45(31.47) | 65(45.46) | 33(23.07) |
| 前列腺癌组 | 134 | 33.74(12.83~82.97) | 12.24(7.89~16.83) | 148.37(74.15~295.16) | 5(3.73) | 10(7.46) | 119(88.81) |
| 统计值 | -7.254 | 3.812 | -11.886 | 120.826 | |||
| P值 | <0.001 | <0.001 | <0.001 | <0.001 | |||
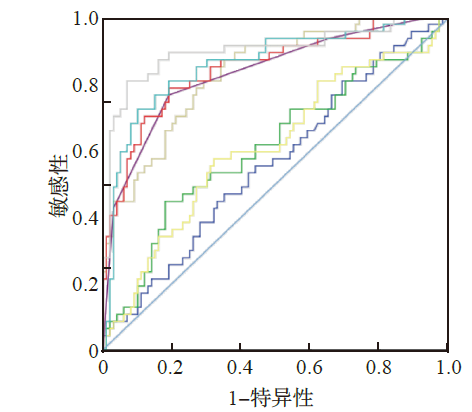
| 项目 | AUC(95%CI) | 最佳临界值 | 敏感性/% | 特异性/% | 约登指数 |
|---|---|---|---|---|---|
| t-PSA | 0.752(0.694~0.810) | 30.82 ng·mL-1 | 55.2 | 89.5 | 0.447 |
| f-PSA/t-PSA% | 0.633(0.567~0.698) | 14.56% | 65.7 | 60.1 | 0.258 |
| PHI | 0.913(0.881~0.946) | 71.39 | 77.6 | 91.6 | 0.692 |
| PI-RADS评分 | 0.881(0.839~0.923) | 4分 | 88.8 | 76.9 | 0.657 |
| 变量 | 单变量回归分析 | 多变量回归分析 | |||
|---|---|---|---|---|---|
| OR值(95%CI) | P值 | OR值(95%CI) | P值 | ||
| t-PSA | 1.042(1.027~1.057) | <0.001 | 0.995(0.990~1.000) | 0.070 | |
| f-PSA/t-PSA% | 0.958(0.931~0.986) | 0.003 | 1.001(0.959~1.045) | 0.969 | |
| PHI | 1.044(1.032~1.056) | <0.001 | 1.035(1.021~1.049) | <0.001 | |
| PI-RADS评分 | 5.562(3.858~8.019) | <0.001 | 2.520(1.672~3.800) | <0.001 | |
| 疾病类型 | 例数 | t-PSA/(ng·mL-1) | f-PSA/t-PSA%/% | PHI | PI-RADS评分 | ||
|---|---|---|---|---|---|---|---|
| ≤2分/ [例(%)] | 3分/ [例(%)] | ≥4分/ [例(%)] | |||||
| 良性疾病 | 100 | 8.43(5.23~12.80) | 17.79(13.39~24.77) | 32.67(24.79~44.53) | 35(35.00) | 46(46.00) | 19(19.00) |
| 前列腺癌 | 47 | 9.68(5.89~13.18) | 14.04(10.29~20.96) | 63.97(44.09~96.53) | 3(6.38) | 8(17.02) | 36(76.60) |
| 统计值 | -1.188 | 2.172 | -6.554 | 45.786 | |||
| P值 | 0.236 | 0.030 | <0.001 | <0.001 | |||
| 疾病类型 | 例数 | t-PSA/(ng·mL-1) | f-PSA/t-PSA%/% | PHI | PI-RADS评分 | ||
|---|---|---|---|---|---|---|---|
| ≤2分/ [例(%)] | 3分/ [例(%)] | ≥4分/ [例(%)] | |||||
| 良性疾病 | 43 | 27.60(24.60~36.30) | 10.56(6.96~18.29) | 43.23(25.85~64.78) | 10(23.26) | 19(44.18) | 14(32.56) |
| 前列腺癌 | 87 | 67.76(38.05~124.48) | 11.55(6.96~14.86) | 267.29(148.37~389.07) | 2(2.30) | 2(2.30) | 83(95.40) |
| 统计值 | -5.965 | 0.364 | -8.578 | 60.179 | |||
| P值 | <0.001 | 0.718 | <0.001 | <0.001 | |||
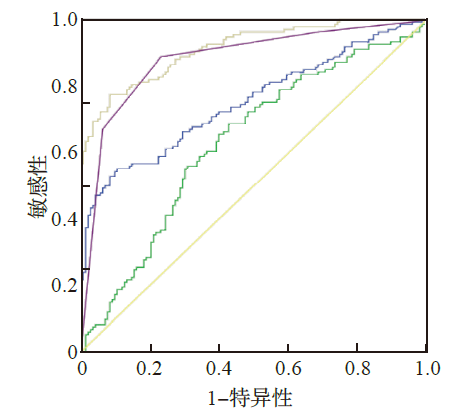
| 项目 | AUC(95%CI) | 最佳临界值 | 敏感性/% | 特异性/% | 约登指数 |
|---|---|---|---|---|---|
| t-PSA | 0.561(0.462~0.660) | 5.55 ng·mL-1 | 80.9 | 31.0 | 0.119 |
| f-PSA/t-PSA% | 0.611(0.510~0.713) | 12.63 | 82.0 | 44.7 | 0.267 |
| PHI | 0.836(0.768~0.903) | 38.83 | 87.2 | 65.0 | 0.522 |
| PI-RADS评分 | 0.834(0.760~0.908) | 4分 | 76.6 | 81.0 | 0.576 |
| t-PSA+f-PSA/t-PSA% | 0.611(0.512~0.711) | 0.338 | 57.4 | 68.0 | 0.254 |
| t-PSA+f-PSA/t-PSA%+PHI | 0.849(0.779~0.919) | 0.320 | 78.7 | 81.0 | 0.597 |
| t-PSA+f-PSA/t-PSA%+PI-RADS评分 | 0.860(0.791~0.929) | 0.500 | 72.3 | 90.0 | 0.623 |
| t-PSA+f-PSA/t-PSA%+PHI+PI-RADS评分 | 0.900(0.837~0.963) | 0.482 | 80.9 | 93.0 | 0.739 |
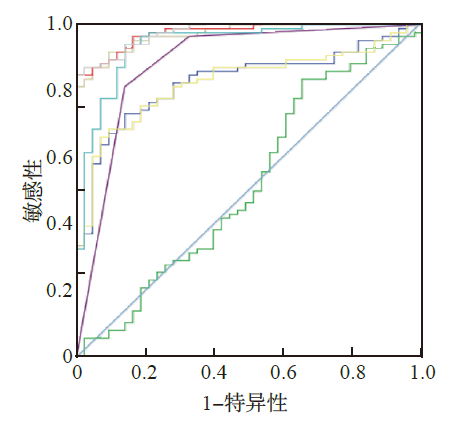
| 项目 | AUC(95%CI) | 最佳临界值 | 敏感性/% | 特异性/% | 约登指数 |
|---|---|---|---|---|---|
| t-PSA | 0.822(0.750~0.894) | 39.48 ng·mL-1 | 72.4 | 86.0 | 0.584 |
| f-PSA/t-PSA% | 0.520(0.409~0.630) | 16.42 | 82.8 | 65.1 | 0.177 |
| PHI | 0.963(0.935~0.991) | 108.05 | 86.2 | 95.3 | 0.815 |
| PI-RADS评分 | 0.875(0.803~0.947) | 5分 | 80.5 | 86.0 | 0.665 |
| t-PSA+f-PSA/t-PSA% | 0.820(0.748~0.892) | 0.663 | 67.8 | 90.7 | 0.585 |
| t-PSA+f-PSA/t-PSA%+PHI | 0.970(0.946~0.994) | 0.820 | 83.9 | 100.0 | 0.839 |
| t-PSA+f-PSA/t-PSA%+PI-RADS评分 | 0.932(0.884~0.979) | 0.618 | 93.1 | 86.0 | 0.791 |
| t-PSA+f-PSA/t-PSA%+PHI+PI-RADS评分 | 0.972(0.951~0.994) | 0.784 | 86.2 | 97.7 | 0.839 |
| [1] | WANG L, LU B, HE M, et al. Prostate cancer incidence and mortality:global status and temporal trends in 89 countries from 2000 to 2019[J]. Front Public Health, 2022,10:811044. |
| [2] | SUNG H, FERLAY J, SIEGEL R L, et al. Global Cancer Statistics 2020:GLOBOCAN estimates of incidence and mortality worldwide for 36 cancers in 185 countries[J]. CA Cancer J Clin, 2021, 71(3):209-249. |
| [3] | MILLER K D, NOGUEIRA L, DEVASIA T, et al. Cancer treatment and survivorship statistics,2022[J]. CA Cancer J Clin, 2022, 72(5):409-436. |
| [4] | HORI S, BLANCHET J S, MCLOUGHLIN J. From prostate-specific antigen(PSA)to precursor PSA(proPSA)isoforms:a review of the emerging role of proPSAs in the detection and management of early prostate cancer[J]. BJU Int, 2013, 112(6):717-728. |
| [5] | STAMEY T A, YANG N, HAY A R, et al. Prostate-specific antigen as a serum marker for adenocarcinoma of the prostate[J]. N Engl J Med, 1987, 317(15):909-916. |
| [6] | NA R, YE D, QI J, et al. Prostate health index significantly reduced unnecessary prostate biopsies in patients with PSA 2-10 ng/mL and PSA >10 ng/mL:results from a multicenter study in China[J]. Prostate, 2017, 77(11):1221-1229. |
| [7] | MO L C, ZHANG X J, ZHENG H H, et al. Development of a novel nomogram for predicting clinically significant prostate cancer with the prostate health index and multiparametric MRI[J]. Front Oncol, 2022,12:1068893. |
| [8] | ZHOU Y, FU Q, SHAO Z, et al. Nomograms combining PHI and PI-RADS in detecting prostate cancer:a multicenter prospective study[J]. J Clin Med, 2023, 12(1):339. |
| [9] | WEINREB J C, BARENTSZ J O, CHOYKE P L, et al. PI-RADS prostate imaging-reporting and data system:2015,version 2[J]. Eur Urol, 2016, 69(1):16-40. |
| [10] | 刘妍. 前列腺癌血清p2PSA衍生指标的研究进展[J]. 中华男科学杂志, 2015, 21(1):74-77. |
| [11] |
黄宜, 王文涓, 许静, 等. p2PSA及其相关指标PHI在前列腺癌诊断中的应用价值[J]. 检验医学, 2019, 34(7):600-604.
DOI |
| [12] | SCHRÖDER F H, CARTER H B, WOLTERS T, et al. Early detection of prostate cancer in 2007. Part 1:PSA and PSA kinetics[J]. Eur Urol, 2008, 53(3):468-477. |
| [13] | HSIEH P F, LI W J, LIN W C, et al. Combining prostate health index and multiparametric magnetic resonance imaging in the diagnosis of clinically significant prostate cancer in an Asian population[J]. World J Urol, 2020, 38(5):1207-1214. |
| [14] | WOO S, SUH C H, KIM S Y, et al. Diagnostic performance of prostate imaging reporting and data system version 2 for detection of prostate cancer:a systematic review and diagnostic meta-analysis[J]. Eur Urol, 2017, 72(2):177-188. |
| [15] | SALTMAN A, ZEGAR J, HAJ-HAMED M, et al. Prostate cancer biomarkers and multiparametric MRI:is there a role for both in prostate cancer management?[J]. Ther Adv Urol, 2021,13:1756287221997186. |
| [16] | LITWIN M S, TAN H J. The diagnosis and treatment of prostate cancer:a review[J]. JAMA, 2017, 317(24):2532-2542. |
| [17] |
TANG P, DU W, XIE K, et al. Transition zone PSA density improves the prostate cancer detection rate both in PSA 4.0-10.0 and 10.1-20.0 ng/ml in Chinese men[J]. Urol Oncol, 2013, 31(6):744-748.
DOI PMID |
| [18] | 王志兵. PI-RADS v2.1联合临床参数在移行带前列腺癌中的应用研究[D]. 苏州: 苏州大学, 2021. |
| [19] | 朱耀, 唐钵, 戴波, 等. 前列腺健康指数在中国男性前列腺癌诊断中的应用研究[J]. 中华外科杂志, 2017, 55(10):734-737. |
| [20] | TEOH J Y, LEUNG C H, WANG M H, et al. The cost-effectiveness of prostate health index for prostate cancer detection in Chinese men[J]. Prostate Cancer Prostatic Dis, 2020, 23(4):615-621. |
| [21] | 仁赵玲, 马润, 胡莹, 等. 前2肽前列腺特异性抗原与前列腺健康指数在前列腺癌诊断中的应用价值[J]. 中国医刊, 2022, 57(4):416-420. |
| [22] | 殷帅涛. 多参数磁共振PI-RADS v2.1评分联合PSA衍生指标在PSA 4-20 ng/ml水平时对前列腺癌的诊断价值[D]. 郑州: 河南大学, 2023. |
| [23] | 路惠茹, 梁亮, 谢宏俊, 等. 前列腺特异性抗原同源异构体2及其衍生指标对PSA 4-20 ng/mL患者前列腺癌的预测价值[J]. 现代泌尿外科杂志, 2023, 28(4):347-350. |
| [1] | SUN Chuanyu, ZHAO Xiaojun, GE Shengyang, ZHANG Yang. Transcription factors in prostate cancer progression [J]. Laboratory Medicine, 2023, 38(9): 818-824. |
| [2] | PENG Wei, LI Yungai, XU Jing, LIU Hua, YANG Cuixia, SHEN Yunyue. Serum inflammatory factors combined with PSA and f-PSA in the auxiliary diagnosis of prostate cancer [J]. Laboratory Medicine, 2023, 38(9): 849-854. |
| [3] | WU Jiong, HU Jiahua, SHI Meifang, LIU Tao, DAI Jie, LU Xinyi, ZOU Zheng. Research progress of biomarkers of prostate cancer [J]. Laboratory Medicine, 2023, 38(2): 190-195. |
| [4] | WANG Linlin, XU Lili, FAN Jun, QIAN Yu. Relationship between oxidative stress markers with prostatic hyperplasia and prostate cancer [J]. Laboratory Medicine, 2022, 37(12): 1135-1140. |
| [5] | QUAN Heng, ZHU Jing, LIAO Huanjin, WU Jun. Role of p2PSA,p2PSA% and PHI in the diagnosis of prostate cancer [J]. Laboratory Medicine, 2021, 36(7): 705-709. |
| [6] | HUANG Xiaofeng, FAN Xueming, YAO Tianyue, YUAN Wenhua, ZHAO Zhiyun, SONG Yunxiao. Correlation between red cell distribution width and prostate cancer [J]. Laboratory Medicine, 2021, 36(6): 590-595. |
| [7] | LI Junsheng, SONG Yunxiao, CHENG Jie. Roles of pretreatment PLR,NLR and LMR in the prognosis of prostate cancer [J]. Laboratory Medicine, 2021, 36(6): 631-636. |
| [8] | YU Ying, LI Jianjie, LI Hanhua, HUANG Juan, WENG Wenhao, CHEN Xuefei. Inhibit miR-4429 proliferation,migration and invasion of prostate cancer cells by targeting metadherin [J]. Laboratory Medicine, 2021, 36(12): 1267-1273. |
| [9] | HUANG Yi, WANG Wenjuan, XU Jing, SHEN Yunyue, LIU Hua, YANG Cuixia. Role of p2PSA and its related marker PHI in the diagnosis of prostate cancer [J]. Laboratory Medicine, 2019, 34(7): 600-604. |
| [10] | YING Xiao, WANG Yuying, WANG Zaihong, WANG Zhenhua. Influence of baicalein on in vitro anti-tumor activity of docetaxel for prostate cancer [J]. Laboratory Medicine, 2018, 33(6): 556-562. |
| [11] | YANG Xiao, GAN Rong, YANG Yingmei, ZHAO Lingxu, BO Jinshuang, GUAN Yanming, MENG Qinghe, L Jianxin.. Modulation of the proliferation, migration and SIRT1 expression of prostate cancer cell PC-3 by miRNA-221 and miRNA-222 [J]. , 2014, 29(5): 446-451. |
| Viewed | ||||||
|
Full text |
|
|||||
|
Abstract |
|
|||||