
Laboratory Medicine ›› 2022, Vol. 37 ›› Issue (10): 921-927.DOI: 10.3969/j.issn.1673-8640.2022.010.003
Previous Articles Next Articles
HE Xuelian1, HE Ziyi2, LIU Yueyang1, YU Yanzhi1, ZHANG Siying1( )
)
Received:2021-09-15
Revised:2021-11-30
Online:2022-10-30
Published:2022-11-14
Contact:
ZHANG Siying
HE Xuelian, HE Ziyi, LIU Yueyang, YU Yanzhi, ZHANG Siying. Role of line chart model based on peripheral blood-derived inflammation markers in early diagnosis of neonatal septicemia[J]. Laboratory Medicine, 2022, 37(10): 921-927.
Add to citation manager EndNote|Ris|BibTeX
URL: https://www.shjyyx.com/EN/10.3969/j.issn.1673-8640.2022.010.003
| 组别 | 例数 | WBC计数/(×109/L) | Hb/(g/L) | PLT计数/ (×109/L) | 预后 | |
|---|---|---|---|---|---|---|
| 好转/[例(%)] | 死亡/[例(%)] | |||||
| 败血症组 | 96 | 13.98±4.14 | 146.45±24.75 | 234.24±107.16 | 90(93.75) | 6(6.25) |
| 对照组 | 96 | 3.05±0.79 | 154.70±28.89 | 265.61±107.28 | 94(97.92) | 2(2.08) |
| 统计值 | 14.310 | 2.125 | 2.027 | 2.087 | ||
| P值 | 0.000 | 0.035 | 0.044 | 0.149 | ||
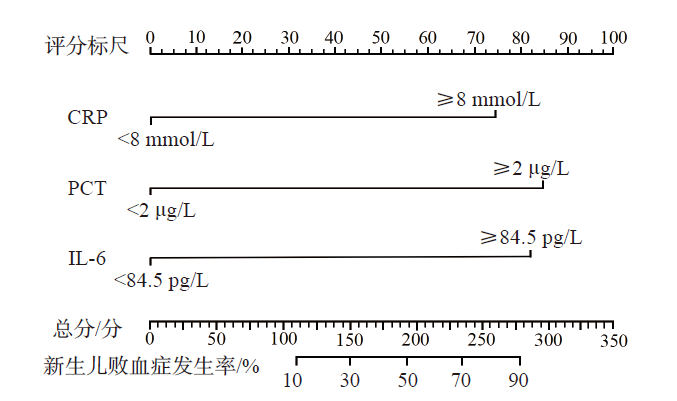
| 组别 | 例数 | CRP/ (mg/L) | PCT/ (μg/L) | IL-6/ (pg/L) |
|---|---|---|---|---|
| 败血症组 | 96 | 12.65±8.94 | 22.18±9.56 | 117.23±31.45 |
| 对照组 | 96 | 3.47±0.61 | 0.19±0.06 | 24.51±10.86 |
| 统计值 | 22.560 | 32.843 | 27.304 | |
| P值 | 0.000 | 0.000 | 0.000 |
| 组别 | 例数 | CRP/ (mg/L) | PCT/ (μg/L) | IL-6/ (pg/L) |
|---|---|---|---|---|
| 败血症组 | 96 | 12.65±8.94 | 22.18±9.56 | 117.23±31.45 |
| 对照组 | 96 | 3.47±0.61 | 0.19±0.06 | 24.51±10.86 |
| 统计值 | 22.560 | 32.843 | 27.304 | |
| P值 | 0.000 | 0.000 | 0.000 |
| 菌株 | 感染例数 | 百分比/% |
|---|---|---|
| 革兰阳性菌 | 44 | 45.83 |
| 表皮葡萄球菌 | 23 | 23.96 |
| 金黄色葡萄球菌 | 12 | 12.50 |
| 溶血性葡萄球菌 | 5 | 5.21 |
| 链球菌 | 2 | 2.08 |
| 其他 | 2 | 2.08 |
| 革兰阴性菌 | 36 | 37.50 |
| 大肠埃希菌 | 16 | 16.67 |
| 肺炎克雷伯菌 | 10 | 10.42 |
| 鲍曼不动杆菌 | 3 | 3.12 |
| 铜绿假单胞菌 | 5 | 5.21 |
| 其他 | 2 | 2.08 |
| 真菌 | 16 | 16.67 |
| 组别 | 例数 | 革兰阳性菌感染 | 革兰阴性菌感染 | 真菌感染 |
|---|---|---|---|---|
| 好转组 | 90 | 41 | 35 | 14 |
| 死亡组 | 6 | 3 | 1 | 2 |
| 组别 | 例数 | 革兰阳性菌感染 | 革兰阴性菌感染 | 真菌感染 |
|---|---|---|---|---|
| 好转组 | 90 | 41 | 35 | 14 |
| 死亡组 | 6 | 3 | 1 | 2 |
| 项目 | β值 | 标准误 | Wald值 | P值 | OR值(95%CI) |
|---|---|---|---|---|---|
| WBC计数 | 0.047 | 0.104 | 0.203 | >0.05 | 1.048(0.624~1.541) |
| Hb | -0.272 | 0.125 | 4.728 | >0.05 | 0.762(0.533~1.124) |
| PLT计数 | -0.297 | 0.086 | 11.931 | >0.05 | 0.743(0.547~1.062) |
| NEUT% | 0.235 | 0.097 | 5.873 | >0.05 | 1.265(0.683~1.747) |
| CRP | 1.079 | 0.059 | 334.722 | <0.05 | 2.943(2.425~3.384) |
| PCT | 1.052 | 0.063 | 278.583 | <0.05 | 2.862(2.531~3.269) |
| IL-6 | 1.070 | 0.054 | 392.531 | <0.05 | 2.915(2.487~3.556) |
| [1] |
SINNAR S A, SCHIFF S J. The problem of microbial dark matter in neonatal sepsis[J]. Emerg Infect Dis, 2020, 26(11):2543-2548.
DOI PMID |
| [2] | 潘莎. 观察丙种球蛋白静脉滴注在新生儿败血症辅助治疗中的效果[J]. 中国继续医学教育, 2020, 12(27):158-160. |
| [3] |
MOLLOY E J, WYNN J L, BLISS J, et al. Neonatal sepsis:need for consensus definition,collaboration and core outcomes[J]. Pediatr Res, 2020, 88(1):2-4.
DOI URL |
| [4] | DONG Y, BASMACI R, TITOMANLIO L, et al. Neonatal sepsis:within and beyond China[J]. Chin Med J (Engl), 2020, 133(18):2219-2228. |
| [5] |
MARKS L, DE WAAL K, FERGUSON J K. Time to positive blood culture in early onset neonatal sepsis:a retrospective clinical study and review of the literature[J]. J Paediatr Child Health, 2020, 56(9):1371-1375.
DOI URL |
| [6] |
BROMIKER R, ELRON E, KLINGER G. Do neonatal infections require a positive blood culture?[J]. Am J Perinatol, 2020, 37(S2):S18-S21.
DOI URL |
| [7] |
BOURIKA V, HANTZI E, MICHOS A, et al. Clinical value of serum amyloid-A protein,high-density lipoprotein cholesterol and apolipoprotein-A1 in the diagnosis and follow-up of neonatal sepsis[J]. Pediatr Infect Dis J, 2020, 39(8):749-755.
DOI URL |
| [8] |
UCIECHOWSKI P, DEMPKE W C M. Interleukin-6:a masterplayer in the cytokine network[J]. Oncology, 2020, 98(3):131-137.
DOI URL |
| [9] |
GLASER M A, HUGHES L M, JNAH A, et al. Neonatal sepsis:a review of pathophysiology and current management strategies[J]. Adv Neonatal Care, 2021, 21(1):49-60.
DOI URL |
| [10] | 史源. 新生儿败血症诊断及治疗专家共识(2019版)解读[J]. 中华实用儿科临床杂志, 2020, 35(11):801-804. |
| [11] |
NORDBERG V, IVERSEN A, TIDELL A, et al. A decade of neonatal sepsis caused by gram-negative bacilli-a retrospective matched cohort study[J]. Eur J Clin Microbiol Infect Dis, 2021, 40(9):1803-1813.
DOI URL |
| [12] |
WATTAL C, KLER N, OBEROI J K, et al. Neonatal sepsis:mortality and morbidity in neonatal sepsis due to multidrug-resistant (MDR) organisms:part 1[J]. Indian J Pediatr, 2020, 87(2):117-121.
DOI URL |
| [13] |
FLEISCHMANN C, REICHERT F, CASSINI A, et al. Global incidence and mortality of neonatal sepsis:a systematic review and meta-analysis[J]. Arch Dis Child, 2021, 106(8):745-752.
DOI URL |
| [14] |
KHAN F. C-reactive protein as a screening biomarker in neonatal sepsis[J]. J Coll Physicians Surg Pak, 2019, 29(10):951-953.
DOI URL |
| [15] | SAYAR S, KURBUZ K, KAHRAMAN R, et al. A practical marker to determining acute severe ulcerative colitis:CRP/albumin ratio[J]. North Clin Istanb, 2019, 7(1):49-55. |
| [16] | TSOU P Y, RAFAEL J, MA Y K, et al. Diagnostic accuracy of procalcitonin for bacterial pneumonia in children-a systematic review and meta-analysis[J]. Infect Dis (Lond), 2020, 52(10):683-697. |
| [17] |
GREGORIANO C, HEILMANN E, MOLITOR A, et al. Role of procalcitonin use in the management of sepsis[J]. J Thorac Dis, 2020, 12(Suppl 1):S5-S15.
DOI URL |
| [18] | 谷磊, 杨玉芹, 王霞. PCT、hs-CRP及二者联合检测对新生儿败血症的诊断价值[J]. 检验医学, 2018, 33(7):597-600. |
| [19] |
BICK A G, PIRRUCCELLO J P, GRIFFIN G K, et al. Genetic interleukin 6 signaling deficiency attenuates cardiovascular risk in clonal hematopoiesis[J]. Circulation, 2020, 141(2):124-131.
DOI PMID |
| [20] |
RIDKER P M, MACFADYEN J G, GLYNN R J, et al. Comparison of interleukin-6,C-reactive protein,and low-density lipoprotein cholesterol as biomarkers of residual risk in contemporary practice:secondary analyses from the Cardiovascular Inflammation Reduction Trial[J]. Eur Heart J, 2020, 41(31):2952-2961.
DOI URL |
| [21] |
ISMAIL HASSAN F, DIDARI T, KHAN F, et al. A review on the protective effects of metformin in sepsis-induced organ failure[J]. Cell J, 2020, 21(4):363-370.
DOI PMID |
| [22] |
WILDE S, OLIVARES K L, NIZET V, et al. Opportunistic invasive infection by group a Streptococcus during anti-interleukin-6 immunotherapy[J]. J Infect Dis, 2021, 223(7):1260-1264.
DOI URL |
| [23] |
LIU C, FANG C, HE Q, et al. The value of interleukin-6 (IL-6) within 6 hours after birth in the prompt diagnosis of early-onset neonatal sepsis[J]. Transl Pediatr, 2020, 9(5):629-635.
DOI PMID |
| [24] |
SUN D, WANG Q, ZHANG X, et al. Clinical application of serum inflammatory factors combined with dynamic detection in the diagnosis and treatment of neonatal sepsis[J]. Iran J Public Health, 2021, 50(2):325-332.
DOI PMID |
| [25] | WEITKAMP J H. The role of biomarkers in suspected neonatal sepsis[J]. Clin Infect Dis, 2021, 73(2):e391-e393. |
| [26] |
EBENEBE C U, HESSE F, BLOHM M E, et al. Diagnostic accuracy of interleukin-6 for early-onset sepsis in preterm neonates[J]. J Matern Fetal Neonatal Med, 2021, 34(2):253-258.
DOI URL |
| [1] | ZHANG Han, LI Jun, LIU Xiaojiang, GUAN Yixiang. Role of serum albumin,interleukin-6 and ferritin combined determination in evaluating the functional prognosis of patients with spontaneous intracerebral hemorrhage [J]. Laboratory Medicine, 2023, 38(8): 713-718. |
| [2] | DING Xiaoyuan, DAI Jinsheng, JIAO Ronghong, MA Suli, ZHU Haifeng, WU Mengya, CHE Yanran, ZHANG Lei. Influence of obesity/overweight on inflammatory factors of Th1/Th2 and Th17/Treg in children with asthma attacks [J]. Laboratory Medicine, 2023, 38(8): 748-752. |
| [3] | LI Li, SUN Haiyan, LI Yuanrui, DOU Min, TANG Wen, JIANG Limin, SHEN Lisong. Changes and clinical roles of perioperative NT-proBNP and PCT in children with congenital heart disease [J]. Laboratory Medicine, 2023, 38(6): 524-531. |
| [4] | WU Caorong, CUI Wen, TANG Binbin, HE Jingjing, LAI Zhikun. Correlations between the ratio of C-reactive protein to prealbumin and the prognosis of patients with acute heart failure [J]. Laboratory Medicine, 2023, 38(6): 579-583. |
| [5] | WANG Xiaofei, FU Jiangtao, ZHU Shuangmei. Prognostic evaluation of IL-6 combined with YKL-40 in head and neck squamous cell carcinoma [J]. Laboratory Medicine, 2022, 37(6): 524-528. |
| [6] | ZHAI Shana, SUN Qinghai, YU Yongwu, YE Fang, LIU Maodong. Influence of vancomycin combined with meropenem on serum TNF-α,PCT,IL-6 and peritoneal fluid WBC count in PDRP patients [J]. Laboratory Medicine, 2022, 37(4): 360-364. |
| [7] | LI Dongxiu, HUANG Jian. Roles of serum sICAM-1 and hs-CRP levels in monitoring acute viral lower respiratory tract infection in children [J]. Laboratory Medicine, 2022, 37(3): 226-229. |
| [8] | SONG Yunxiao, TONG Wei, ZHANG Haichen, ZHANG Yinwang, BIAN Xiaobo, ZHANG Linlin, YUAN Wenhua, ZHAO Zhiyun, GE Wen, YAO Tianyue. Correlation of systemic inflammatory markers and fracture occurrence in elderly patients with osteoporosis [J]. Laboratory Medicine, 2022, 37(3): 235-239. |
| [9] | GU Feng, WU Yanfen, ZHAO Xinhui, HOU Zhaoyuan, WANG Zhihong, QI Hualin. Relationship between procalcitonin level and all-cause death in maintenance hemodialysis patients [J]. Laboratory Medicine, 2022, 37(2): 134-140. |
| [10] | YAO Hualong. Roles of PTH,CRP,OPG/PYR ratio in elderly patients with osteoporosis [J]. Laboratory Medicine, 2022, 37(12): 1146-1150. |
| [11] | LIU Chunxiao, YI Changlin, WANG Xiaoshan, ZHU Yongzhen, LUO Aner, CHEN Changqiang. Roles of MxA,CRP and WBC count in the differential diagnosis of acute respiratory tract viral and bacterial infections [J]. Laboratory Medicine, 2022, 37(10): 944-947. |
| [12] | XIONG Zhongbo, WANG Lei, YIN Beiqi, DAI Yue, WEI Xiaoqing, LU Pei. Clinical roles of SAA and CRP in pathological staging and metastasis of gastrointestinal cancer [J]. Laboratory Medicine, 2022, 37(1): 51-55. |
| [13] | HU Bing, LI Gai, ZHANG Huimin. Roles of serum interleukin-6 and D-dimer levels in predicting the risk of cerebral hemorrhage in patients with hypertension [J]. Laboratory Medicine, 2022, 37(1): 63-67. |
| [14] | LI Caidong, ZHANG Xuqiang, LEI Zhiping, CHEN Qiaoli, CHEN Lu, TIAN Pengfei, DUAN Zhengjun. Clinical values of IL-1β,IL-6 and TNF-α in different clinical courses of chronic HBV infection [J]. Laboratory Medicine, 2021, 36(8): 790-794. |
| [15] | WANG Zipeng, OUYANG Changli, GENG Deqin, WANG Dunjing. Establishment of cerebrospinal fluid IL-6 reference interval in non-inflammatory central nervous system diseases [J]. Laboratory Medicine, 2021, 36(6): 627-630. |
| Viewed | ||||||
|
Full text |
|
|||||
|
Abstract |
|
|||||