
Laboratory Medicine ›› 2017, Vol. 32 ›› Issue (5): 353-360.DOI: 10.3969/j.issn.1673-8640.2017.05.002
• Orginal Article • Previous Articles Next Articles
LIU Fenghua, WANG Lijie, ZHOU Yunheng, LI Jian, HU Qiong
Received:2016-06-20
Online:2017-05-20
Published:2017-06-06
CLC Number:
LIU Fenghua, WANG Lijie, ZHOU Yunheng, LI Jian, HU Qiong. Combined determination of 15 biochemical indicators for the first treatment of malignant liver tumors[J]. Laboratory Medicine, 2017, 32(5): 353-360.
Add to citation manager EndNote|Ris|BibTeX
URL: https://www.shjyyx.com/EN/10.3969/j.issn.1673-8640.2017.05.002
| 组别 | 例数 | TB(μmol/L) | DBil(μmol/L) | TBA(μmol/L) | CG(μg/L) | ALT(U/L) | ||||||
|---|---|---|---|---|---|---|---|---|---|---|---|---|
| PHC组 | 54 | 16.9(11.9~25.5)* | 6.5(4.7~10.7)* | 11.1(6.7~23.5)*# | 3.5(1.7~9.9)*# | 37(25~56)*# | ||||||
| MHC组 | 54 | 14.0(8.9~21.7)* | 4.7(3.6~8.0)* | 9.0(6.1~12.4)* | 1.7(1.1~4.0)* | 23(16~35)* | ||||||
| NC组 | 120 | 12.5(10.0~16.0) | 3.7(3.1~4.8) | 1.9(1.4~2.3) | 0.6(0.5~0.8) | 18(14~24) | ||||||
| 组别 | AST(U/L) | m-AST(U/L) | ALP(U/L) | GGT(U/L) | LDH(U/L) | |||||||
| PHC组 | 38(25~66)*# | 13(9~22)*# | 117(84~195)* | 98(49~235)*# | 204(169~278)*# | |||||||
| MHC组 | 27(22~41)* | 9(8~14)* | 95(72~172)* | 68(42~125)* | 258(176~389)* | |||||||
| NC组 | 18(16~21) | 6(5~7) | 59(53~69) | 15(11~20) | 162(147~183) | |||||||
| 组别 | CHE(U/L) | TP(g/L) | Alb(g/L) | A/G比值 | PA(mg/L) | |||||||
| PHC组 | 5 357 ± 2 153*# | 71.1 ± 7.4*# | 40.1 ± 4.7* | 1.3 ± 0.3* | 129 ± 55* | |||||||
| MHC组 | 5 341 ± 2 044* | 68.0 ± 6.5* | 39.0 ± 5.3* | 1.4 ± 0.3* | 133 ± 57* | |||||||
| NC组 | 8 167 ± 1 187 | 73.6 ± 3.4 | 46.2 ± 2.2 | 1.7 ± 0.2 | 237 ± 40 | |||||||
| 项目 | AUC | OOP | Youden指数 | +LR | LR- |
|---|---|---|---|---|---|
| PA | 0.972 | 167 mg/L | 86.2 | 104.4 | 0.1 |
| GGT | 0.968 | 31 U/L | 83.4 | 10.1 | 0.1 |
| CG | 0.966 | 1.2 μg/L | 84.1 | 13.6 | 0.1 |
| TBA | 0.945 | 6.7 μmol/L | 77.3 | 19.6 | 0.2 |
| ALP | 0.940 | 83 U/L | 72.3 | 8.9 | 0.2 |
| Alb | 0.931* | 42.1 g/L | 76.1 | 46.7 | 0.2 |
| AST | 0.931* | 26 U/L | 77.3 | 19.6 | 0.2 |
| m-AST | 0.923* | 8 U/L | 68.1 | 4.3 | 0.1 |
| CHE | 0.901* | 6 013 U/L | 73.6 | 18.7 | 0.2 |
| A/G比值 | 0.875* | 1.48 | 66.1 | 6.7 | 0.3 |
| DBil | 0.867* | 5.8 μmol/L | 59.4 | 7.5 | 0.4 |
| ALT | 0.836* | 29 U/L | 57.0 | 5.3 | 0.3 |
| TBil | 0.783* | 16.3 μmol/L | 50.0 | 4.0 | 0.4 |
| LDH | 0.747* | 196 U/L | 46.6 | 5.3 | 0.5 |
| 项目 | AUC | OOP | Youden指数 | +LR | LR- |
|---|---|---|---|---|---|
| PA | 0.920 | 195.0 mg/L | 70.2 | 5.7 | 0.2 |
| Alb | 0.906 | 42.8 g/L | 69.9 | 17.8 | 0.3 |
| GGT | 0.901 | 21.0 U/L | 64.7 | 3.7 | 0.2 |
| CHE | 0.892 | 6 126.0 U/L | 70.9 | 15.2 | 0.3 |
| TBA | 0.852 | 6.4 μmol/L | 56.1 | 12.2 | 0.4 |
| ALP | 0.849* | 75.0 U/L | 53.1 | 3.8 | 0.3 |
| A/G比值 | 0.791* | 1.38 | 48.5 | 15.6 | 0.5 |
| LDH | 0.788* | 190.0 U/L | 50.0 | 4.0 | 0.4 |
| CG | 0.785* | 0.9 μg/L | 53.1 | 5.6 | 0.4 |
| DBil | 0.709* | 6.4 μmol/L | 42.1 | 11.1 | 0.6 |
| TP | 0.705* | 67.6 g/L | 45.0 | 10.0 | 0.5 |
| AST | 0.693* | 26.0 U/L | 42.1 | 11.1 | 0.6 |
| m-AST | 0.693* | 9.0 U/L | 36.1 | 5.3 | 0.6 |
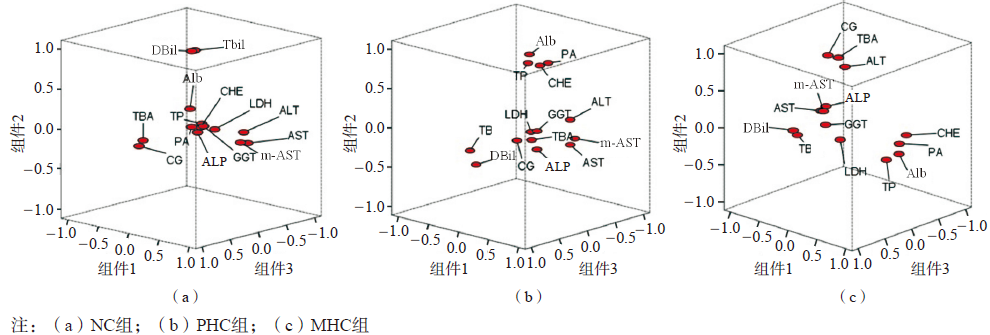
| 组别 | 公共因子1 | 公共因子2 | 公共因子3 | 公共因子4 | 公共因子5 | 公共因子6 | 公共因子7 | 公共因子8 |
|---|---|---|---|---|---|---|---|---|
| PHC组 | ALT、AST、m-AST | CHE、TP、Alb、PA | TB、DBil | ALP、GGT | TBA、CG | LDH | ||
| MHC组 | CHE、TP、Alb、PA | TBA、CG | TB、DBil | ALT、AST、m-AST | ALP、GGT | LDH | ||
| NC组 | ALT、AST、m-AST | TB、DBil | TBA、CG | TP、Alb | GGT、PA | CHE | ALP | LDH |
| [1] | 王健,张慧,吴月平. 多指标联合检测对原发性肝癌的诊断价值分析[J]. 检验医学与临床,2013,10(11):1379-1380. |
| [2] | 陈卫中,倪宗瓒,潘晓平,等. 用ROC曲线确定最佳临界点和可疑值范围[J]. 现代预防医学,2005,32(7):729-731. |
| [3] | 熊立凡,王鸿利. 临床实验室检验项目的优化组合与临床循证[C]. 武汉:中华医学会检验分会,2006. |
| [4] | 徐玉兵,房萌,张洁,等. 原发性肝细胞癌患者术前染料排泄试验ICGR15检测与肝功能指标的比较研究[J]. 中华检验医学杂志,2015,38(11):733-736. |
| [5] | 李天蜜. 临床检验6项肝功能指标的联合检测对肝病诊断的临床价值研究[J]. 中国医药指南,2014,12(29):272. |
| [6] | 朱倩,李云,段睿,等. 血清前白蛋白水平对肝切除术后肝功能不全发生的影响[J]. 中国普通外科杂志,2016,25(1):109-114. |
| [7] | 李瑞芳. 血清AST/ALT比值,γ-GT,ALP及AFP联合检测对原发性肝癌的诊断价值[J]. 临床医药实践,2015,42(10):757-758. |
| [8] | 邓锡源,马苏美,李辉,等. ARFI技术与血清总胆汁酸在慢性丙型肝炎肝硬化Child-Pugh分级中的应用[J]. 世界华人消化杂志,2016,24(2):287-292. |
| [9] | 蒋红卫,张罗漫,孟虹. logistic回归模型共线性三种降维方法的模拟比较研究[J]. 中国卫生统计,2010,27(6):562-566. |
| [10] | YI H,WO H,ZHAO Y,et al.Comparison of dimension reduction-based logistic regression models for case-control genome-wide association study: principal components analysis vs. partial least squares[J]. J Biomed Res,2015,29(4):298-307. |
| [11] | 李金鹏,石丛丛,宋金龙,等. 血清LDH的水平与肝癌介入治疗预后的关系[J]. 中国肿瘤临床,2013,51(6):332-335. |
| [12] | 张庆莲,张青云. 乳酸脱氢酶同工酶在肿瘤诊断中的临床意义[J]. 中华临床实验室管理电子杂志,2015,3(2):82-86. |
| [13] | 张如超,杨延音,谭韬,等. 血清甘胆酸检测方法研究进展[J]. 科学咨询(科技·管理),2015,16(8):58-59. |
| [14] | 曾正莲. 甘胆酸检测在肝胆疾病诊断中的应用价值[J]. 检验医学与临床,2015,12(Z2):179-180. |
| [15] | 孙华宝,叶德强,曹立,等. logistic回归和ROC曲线评价8种原发性肝癌实验室诊断指标的临床价值[J]. 广东医学,2010,31(20):2650-2653. |
| [16] | 秦正积,沈毅,崔晓莉,等. logistic回归在疾病多指标联合诊断中的应用[J]. 中国卫生统计,2014,31(1):116-117. |
| [17] | 周菲,赵凤兰,魏兴民,等. Logistic回归模型多重共线性诊断及在医学中的应用[J]. 甘肃中医学院学报,2014,31(1):90-93. |
| [18] | 汪朋. 主成分回归克服多重共线性的R语言实现[J]. 科技资讯,2015,13(28):251-252. |
| [1] | TONG Lin, HUANG Chenjun, GAO Zhiyuan, ZHOU Jun, FANG Meng, XIAO Xiao, HE Yutong, HONG Song, XU Minfan, ZHU Feifei, GAO Chunfang. Study on the judgment model of preoperative microvascular invasion in HCC based on common clinical determination items [J]. Laboratory Medicine, 2020, 35(8): 741-748. |
| [2] | YAN Yufei, JIN Yiming, LIU Mingli, DENG Xuemei, QIN Qin. Role of neutrophil/lymphocyte ratio in SARS-CoV-2 infection [J]. Laboratory Medicine, 2020, 35(7): 637-639. |
| [3] | CHEN Yabin, JIANG Yancheng, CHEN Zixuan, YANG Wei, ZHANG Zhishan. Diagnostic cut-off value of HbA2 for screening thalassemia and the combined determination of HbA2,MCV and MCH [J]. Laboratory Medicine, 2019, 34(4): 318-321. |
| [4] | ZHANG Haichen, WANG Hao, SONG Yunxiao, MA Jin. Combined determination of multiple tumor markers for the diagnosis of primary lung cancer [J]. Laboratory Medicine, 2018, 33(7): 590-596. |
| [5] | LU Qiuya, LU Yide, SUN Aihua, MA Weiyun, ZHOU Yiqiong, WANG Xuefeng. Thromboelastography-MA parameter in the diagnosis of acute coronary syndrome [J]. Laboratory Medicine, 2018, 33(2): 119-123. |
| [6] | YANG Yan, ZHANG Fujun, SHEN Songkun, WANG Houzhao. NT-proBNP,cTnI,Hcy,DD and hs-CRP for the diagnosis of coronary heart disease by ROC curves [J]. Laboratory Medicine, 2018, 33(1): 15-19. |
| [7] | HU Yuyi, WU Hui, HAN Xu, ZHANG Chunyan, GUO Wei, LOU Wenhui, PAN Baishen. Performance of double-antibody sandwich ELISA for chromogranin A determination [J]. Laboratory Medicine, 2018, 33(1): 55-59. |
| [8] | LI Zhifeng, WANG Jue, LIU Genyan, ZHAO Wangsheng, MEI Yaning. Establishment and clinical evaluation on a regression model of coagulase-negative Staphylococcus as pathogenic bacterium in blood culturing [J]. Laboratory Medicine, 2017, 32(3): 189-193. |
| [9] | XIN Na, JING Fahong, LI Jingmei, MU Yudong. Serum soluble triggering receptor expressed on myeloid cell-1 in the diagnosis of sepsis [J]. Laboratory Medicine, 2017, 32(12): 1114-1117. |
| [10] | MA Hongxia, ZHOU Yunheng, MA Liang, SHEN Jianfeng, LI Yang. Comparison of main biochemical indicators between healthy subjects and sub-healthy subjects with different sex [J]. Laboratory Medicine, 2016, 31(12): 1011-1016. |
| [11] | ZHAO Junfang, LI Guizhen, CHEN Xuewen. Determinations of OX40 mRNA,OX40L mRNA and anti-C1q antibody and their diagnosis performance in peripheral blood of patients with lupus nephritis [J]. Laboratory Medicine, 2016, 31(10): 889-893. |
| [12] | GU Xiangming, HUANG Jiesheng, LI Yingying, DU Guoyou.. Application of serum homocysteine and C reactive protein in the diagnosis of acute cerebral vascular diseases [J]. Laboratory Medicine, 2015, 30(4): 337-340. |
| [13] | LI Duofu, CHEN Yulin, XIA Yu. Evaluation on the clinical diagnosis efficiency of pleural fluid ADA and LDH for tuberculous pleuritis [J]. Laboratory Medicine, 2015, 30(10): 987-990. |
| [14] | ZHAO Ying, HUANG Fei, SONG Binbin, GUO Wei, PAN Baishen.. The analytical performance evaluation of BioPlexTM 2200 automatic immunoassay analyzer for the determination of anti-cyclic citrullinated peptide antibodies [J]. , 2014, 29(2): 153-157. |
| [15] | FAN Hongjia, TANG Jin, WANG Jianqiang, CHEN Weibin, CHEN Yu, GAO Feng. Significance of routine urinalysis in the diagnosis of urinary tract infection [J]. , 2014, 29(12): 1207-1211. |
| Viewed | ||||||
|
Full text |
|
|||||
|
Abstract |
|
|||||